Background
Silver prices peaked in April 2011 and dropped about 60% over the next 25 months. Sentiment by almost any measure is currently terrible. Few are interested in silver; most have lost money (on paper) if they bought in the last two and one half years, and the emotional pains seems considerable. It reminds me of the years after the NASDAQ crash in 2000.
So will silver drop under $15 or rally back above $50?
To help answer that question, I examined the chart of silver for the last 25 years and identified several long-term cycles. Then I constructed a spreadsheet that attempted to model the price of weekly silver based on those cycles and a few assumptions.
For FULL ARTICLE

Tuesday, June 11, 2013

Monday, June 10, 2013
Public opinion- Silver
"Public opinion towards silver is at very low reading and that must be interpreted as bullish." www.sentimenTrader.com
Silver Market Update [originally published June 10th, 2013 by Clive Maund on clivemaund.com]
Clive Maund's latest update on silver is as follows:
"While silver is on the defensive short-term there is plenty of evidence that over the medium and longer-term it is setting up for a powerful rally. COT's and sentiment are already very bullish indeed, which means that when the turn does come, the rally is likely to be accentuated by panic short covering.
On its 6-month chart we can see how silver is being pressured lower by its falling 50-day moving average coming into play overhead, although the increasingly large gap between the 50 and 200-day moving averages is indicative of an oversold state that increasingly calls for reversal. Volume is still predominantly negative, suggesting lower prices dead ahead. After that we can expect reversal. There was a pronounced bull hammer in silver in the middle of May towards the intraday low of which there is quite strong support- silver may drop no longer than the low of this hammer."

"While silver is on the defensive short-term there is plenty of evidence that over the medium and longer-term it is setting up for a powerful rally. COT's and sentiment are already very bullish indeed, which means that when the turn does come, the rally is likely to be accentuated by panic short covering.
On its 6-month chart we can see how silver is being pressured lower by its falling 50-day moving average coming into play overhead, although the increasingly large gap between the 50 and 200-day moving averages is indicative of an oversold state that increasingly calls for reversal. Volume is still predominantly negative, suggesting lower prices dead ahead. After that we can expect reversal. There was a pronounced bull hammer in silver in the middle of May towards the intraday low of which there is quite strong support- silver may drop no longer than the low of this hammer."

Read the FULL ARTICLE
Sunday, June 2, 2013
Gold/Silver ratio monthly chart---trend is down!
After analysing the Gold/Silver ratio monthly chart, it is clear to anybody that the trend is down during this secular gold and silver bull market, notwithstanding it is recently up (past 2 years) within the down trend. If my thesis is correct, it is my opinion that silver will do much better than gold in percentage points term during the next phase of the bull market. To give some perspective, if gold indeed reaches a target of between $3500-$5000/ounce mark at the end of this bull market, with a gold/silver ratio of 15, silver will be trading around $230-$330/ounce mark. That's an approx. 150%-260% upside in gold from current levels and approx. 940%-1390% upside in silver! Silver clearly outperforming gold!


Saturday, June 1, 2013
Thursday, May 30, 2013
CPI ADJUSTED SILVER PRICE

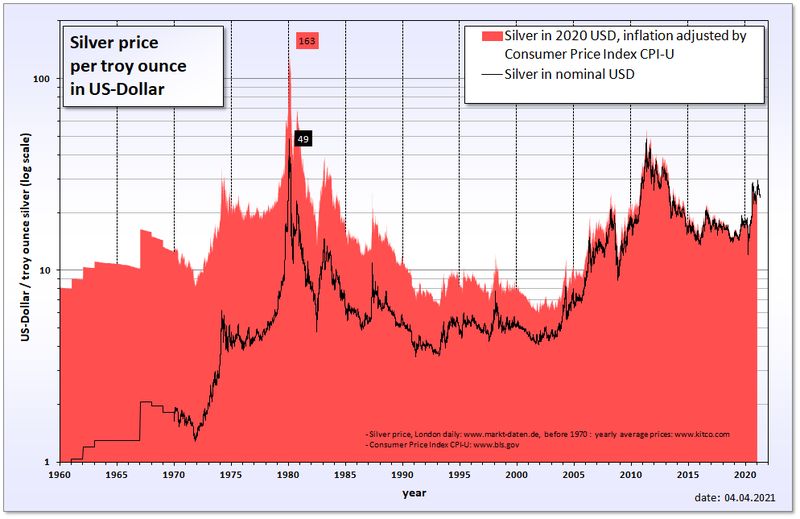
Silver is still below both the 1980 nominal high of $50.00/ounce and the CPI inflation adjusted price of 1980 which is equal to $125.74/ounce.
Wednesday, May 29, 2013
60% silver correction. Would this then be the low?
Using 49.80 as the high and 19.40 as the low, that would be a 61% correction in silver. This correction then would be approximately the same depth (60.5%) as the 2008 remarkable drop. So 19.40 should provide a stout support with many traders and investors stepping in at this price. Could it go lower than this? Given the suspicious price discovery mechanism at the COMEX, I have no doubts that it could, but surely the strong physical demand from China and major central banks of the world will put a floor or limit the downside? We have to wait and see.
The other possibility is, we don't see below 20.00 and we see a turn around from here. Time will tell.
The other possibility is, we don't see below 20.00 and we see a turn around from here. Time will tell.
Sunday, May 26, 2013
Silver & Gold - The BIG Picture - Mike Maloney
"By the way we did a study on the true price of silver coming out of the ground. It is about $20 per ounce. It varies mine to mine but that is a good all in cost for now. Mid year 2013." silver-investor.com [David Morgan]
The Macro View: Gold for the long run [DarienTimes.com; By James Rickards on May 25, 2013]
James Rickards is a hedge fund manager in New York City and the author of “Currency Wars: The Making of the Next Global Crisis” from Portfolio/Penguin
This article as it was for me, will be for you, provide some comfort if you have invested in gold and silver during the down cycle of the past two years...
Please click on the link provided below:
http://www.darientimes.com/20199/the-macro-view-gold-for-the-long-run/
This article as it was for me, will be for you, provide some comfort if you have invested in gold and silver during the down cycle of the past two years...
Please click on the link provided below:
http://www.darientimes.com/20199/the-macro-view-gold-for-the-long-run/
Saturday, May 25, 2013
Trading and/or Investing in silver
If you did your homework and came to the conclusion that gold bull market is not over yet, and will continue to appreciate against the currencies it is measured, then silver is a leveraged way to play gold. This is because throughout history, silver follows the direction and outperforms gold in percentage terms on the way up. The downside is, it has an equal effect on the way down. It is widely referred to as gold on steroids, so trade and invest carefully!
Another thing to note is the gold to silver ratio. Currently 1 oz of gold is equal to 62 oz of silver. People that have studied history will know that this ratio will eventually need to return to 15. Ie 1 oz of gold is equal to 15 oz of silver. Silver has a lot of catching up to do and is undervalued when priced against gold given the historical ratio and deserving some thought when choosing between gold or silver.
Another thing to note is the gold to silver ratio. Currently 1 oz of gold is equal to 62 oz of silver. People that have studied history will know that this ratio will eventually need to return to 15. Ie 1 oz of gold is equal to 15 oz of silver. Silver has a lot of catching up to do and is undervalued when priced against gold given the historical ratio and deserving some thought when choosing between gold or silver.
Wednesday, May 22, 2013
Tuesday, May 21, 2013
Price of silver in the early 15th century- surpassed $1200 per ounce!!!
In the early 15th century, the price of silver is estimated to have surpassed $1,200 per ounce, based on 2011 dollars. The discovery of massive silver deposits in the New World the succeeding centuries has been stated as a cause for its price to have diminished greatly.
Source:
http://en.wikipedia.org/wiki/Silver
Source:
http://en.wikipedia.org/wiki/Silver
Monday, May 20, 2013
Sunday, May 19, 2013
Is the world about to run out of silver?
In the latest, May 2013 Silver Bullion Newsletter, Gregor Gregersen answers some questions regarding Bullion supplies:
Is the world about to run out of silver?
Ans: Not necessarily. The extreme silver tightness is for investment grade Silver Bullion as opposed to silver in general. Mints and refineries simply do not have enough manufacturing capacity to convert raw silver into coins and bars. Silver grains (used by industry) and rough 1,000 oz poured bars are still available.
Keep in mind however that futures exchanges normally hold less than 3% in physical reserves of their net long positions. So if a major investor or bank were allowed to take a large physical delivery we could easily see an all out scarcity or market cornering as occurred in the late 1970s when physical silver was bid up to almost 50 USD (250+ USD in today's currency after adjusting for inflation).
Is the world about to run out of silver?
Ans: Not necessarily. The extreme silver tightness is for investment grade Silver Bullion as opposed to silver in general. Mints and refineries simply do not have enough manufacturing capacity to convert raw silver into coins and bars. Silver grains (used by industry) and rough 1,000 oz poured bars are still available.
Keep in mind however that futures exchanges normally hold less than 3% in physical reserves of their net long positions. So if a major investor or bank were allowed to take a large physical delivery we could easily see an all out scarcity or market cornering as occurred in the late 1970s when physical silver was bid up to almost 50 USD (250+ USD in today's currency after adjusting for inflation).
Wednesday, May 15, 2013

Monday, May 13, 2013
Relationship between falling gold prices and mining- Alix steel speaks on "Bloomberg Surveillance." (Source: Bloomberg)

White line demonstrates the accumulation production all-in cash cost. That means how much it costs to produce an ounce of gold (plus re-investing etc).....and that is on the rise and is above the current gold price (demonstrated by the red line)
Saturday, May 11, 2013
The commodities market
The commodities market became bullish in 1999. Based on historical precedent (happened in cycles of fifteen to twenty-three years), the commodity bull may run until sometime between 2014 and 2022, although there will be some setbacks along the way. In the 1970s gold at one point went up 600 percent before beginning to react. It consolidated and declined 50 percent over a two-year period, causing many to give up. It then turned around and rose 850 percent. That is how markets work.
- Jim Rogers (Author of book: A gift to my children)
Gold and silver is currently consolidating and declining. Have you given up or are you still holding?
- Jim Rogers (Author of book: A gift to my children)
Gold and silver is currently consolidating and declining. Have you given up or are you still holding?
Monday, May 6, 2013
In-stock Inventory at Silver Bullion Pte. Ltd. [Updated 6/5/2013 10:06]

Based on the current inventory as seen in the above chart from silverbullion.com.sg, there aren't any available physical silver to be acquired at the current price (updated 6 May 2013 10:27PM) of USD23.91 [SGD29.50]. From the silver bullion bars range only the Perth Mint Silver Bar (1KG) can be pre-ordered with a 5 weeks wait period. The rest are sold out and no pre-orders available. Now if the prices were to go lower from here (say USD21.00, 19.00, 15.00?), who'd be able to get their hands on some physical silver given that it is unattainable even at current prices?
Now with that said, it would make no sense at all (if) the prices were to go lower from here because you'd think with this remarkable physical demand, prices should be going north. But the daily silver prices are determined by the COMEX. Most of what is traded in these contracts represents silver that does not exist. Effectively, the price discovery mechanism for silver seems to be broken. However, price management/manipulation can only be temporary because eventually, physical shortages will occur which will drive prices higher.
Monday, April 29, 2013
Metals- Expiration calender, Futures Expirations
Expiration Calender - Futures ExpirationsMetals | ||||||||||||||||||||||||
| Contract | Apr | May | Jun | Jul | Aug | Sep | Oct | Nov | Dec | Jan | Mar | Mar | ||||||||||||
| Gold | 04/26 | 05/29 | 06/26 | 08/28 | 10/29 | 12/27 | 02/26 | |||||||||||||||||
| Silver | 04/26 | 05/29 | 06/26 | 07/29 | 09/26 | 12/27 | 01/29 | 03/27 | ||||||||||||||||
| High Grade Copper | 04/26 | 05/29 | 06/26 | 07/29 | 08/28 | 09/26 | 10/29 | 11/26 | 12/27 | 01/29 | 02/26 | 03/27 | ||||||||||||
| Platinum | 04/26 | 05/29 | 06/26 | 07/29 | 10/29 | 01/29 | ||||||||||||||||||
| Palladium | 04/26 | 05/29 | 06/26 | 07/01 | 09/26 | 12/27 | 03/27 | |||||||||||||||||
| Mini-Sized Gold | 04/26 | 05/29 | 06/26 | 08/28 | 10/29 | 12/27 | 02/26 | |||||||||||||||||
| Mini-Sized Silver | 04/26 | 05/29 | 06/26 | 07/29 | 09/26 | 12/27 | 01/29 | 03/27 | ||||||||||||||||
The closer it gets to the time of the contract's expiration, the more solid the information entering the market will be regarding the commodity in question.
Subscribe to:
Posts (Atom)