
Wednesday, April 17, 2013
Economic principle
Lower commodity prices increase demand and curtail supply. This is because price decline does not cause companies (miners) to rush into increasing production and buying pressure increases to take advantage of bargain prices.
Tuesday, April 16, 2013
CME Margin updates
CME Group Margin Changes Effective CLOSE of Business on 4/16/13
Previous Initial
|
Previous Maintenance
|
New Initial
|
New Maintenance
| |
10 Troy oz Gold (MGC) – spec months 1-13+
|
$594
|
$540
|
$704
|
$640
|
10 Troy oz Gold (MGC) –hedge months 1-13+
|
$540
|
$540
|
$640
|
$640
|
COMEX Gold (GC) – spec months 1-13+
|
$5940
|
$5400
|
$7040
|
$6400
|
COMEX Gold (GC) – hedge months 1-13+
|
$5400
|
$5400
|
$6400
|
$6400
|
COMEX miNY Gold (QO) – spec months 1-13+
|
$2970
|
$2700
|
$3520
|
$3200
|
COMEX miNY Gold (QO) – hedge months 1-13+
|
$2700
|
$2700
|
$3200
|
$3200
|
COMEX 5000 Silver (SI) – spec months 1-13+
|
$10,450
|
$9500
|
$12,375
|
$11,250
|
COMEX 5000 Silver (SI) – hedge months 1-13+
|
$9500
|
$9500
|
$11,250
|
$11,250
|
COMEX miNY Silver (QI) – spec months 1-13+
|
$5225
|
$4750
|
$6188
|
$5625
|
COMEX miNY Silver (QI) – hdge months 1-13+
|
$4750
|
$4750
|
$5625
|
$5625
|
eMini Silver (6Q) – spec months 1-13+
|
$2090
|
$1900
|
$2475
|
$2250
|
eMini Silver (6Q) – hedge months 1-13+
|
$1900
|
$1900
|
$2250
|
$2250
|
Re-evaluation of accumulation zone for silver
Given gold sliced through the 1350-1370 zone effortlessly, perhaps due to the margin related selling as the CME is raising gold and silver margins, we may have to expect silver to plummet more from the current level. Accumulation zone may arrive if silver goes down further between the 15 to 19.4 levels (this is not a prediction). Being a silver bull, I don't like giving an ugly picture but have to be realistic. As you witnessed yourself, silver can drop more than 3 dollars a day (-12%+) in a single trading day so from the current level of 22.63 (3:09:48 GMT), it doesn't seem hard to drop down further to the 19 dollar level. Based on the weekly chart of silver, I see a lot of support at the 15 dollar level so I'm crossing my fingers that this level will hold.
Having said that, after speaking with a multimillionaire investor who has invested multi millions in both physical and gold & silver savings account (paper), he told me that his thoughts were the following:
If you are a long term investor (without margin), and given you have done your homework and have the conviction that your investment vehicle (ie gold & silver) is ultimately going to much higher levels; than what happens in between for him is like as if it never happened. He bought gold because of world's central banks printing money and devaluing their currency, which will eventually lead to inflationary environment and gold (and silver) is a great store of value. For him nothing has changed.

Sunday, April 14, 2013
Healthy correction in the precious metals
According to, Monty Guild (www.guildinvestment.com), "The Chinese and other wise buyers will add aggressively at 1350-1370, which would be approximately one third correction from 2002 bottom to 1900 top." FULL ARTICLE
If you are looking for a good entry point for silver to go long position; perhaps a good time to do that is when gold indeed targets 1350-1370 zone. Seeing as the current trend is Up for the gold:silver ratio, let's assume a ratio of 63 (from the current level of 57) when gold is 1350. This would mean a price of 21.40 silver.
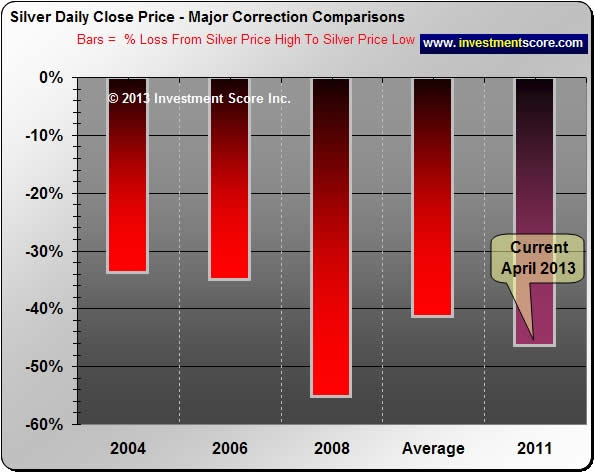
Although I don't particularly like seeing silver being smacked down from the 49.00 (and some change) high, the more experienced and wise investors like Mr Jim Rogers may view this as a healthy bull market correction or pull back. To give an example, in 2008, silver fell an impressive 55% from peak to trough.
See the brilliant chart below by Investment Score Inc. ,by:Michael Kilback

If you are looking for a good entry point for silver to go long position; perhaps a good time to do that is when gold indeed targets 1350-1370 zone. Seeing as the current trend is Up for the gold:silver ratio, let's assume a ratio of 63 (from the current level of 57) when gold is 1350. This would mean a price of 21.40 silver.
Although I don't particularly like seeing silver being smacked down from the 49.00 (and some change) high, the more experienced and wise investors like Mr Jim Rogers may view this as a healthy bull market correction or pull back. To give an example, in 2008, silver fell an impressive 55% from peak to trough.
See the brilliant chart below by Investment Score Inc. ,by:Michael Kilback
Subscribe to:
Posts (Atom)